Unlocking and updating deprivation insights: the IoD2025

Since the 1970s the Ministry of Housing, Communities and Local Government (MHCLG) and its predecessors have calculated local measures of relative deprivation in England. Deprivation is nuanced and multifaceted – people may be living in poverty if they lack the financial resources to meet their needs, whereas people may be regarded as deprived if they lack any kind of resources, not just financial. This extends to diet, housing, education, work and social conditions, for example. These needs and necessities may change and evolve over time, but relative deprivation remains.
In October 2025, MHCLG published the English Indices of Deprivation 2025 (IoD25), the latest iteration of these statistics. The release is an accredited official statistic, considered the gold standard of government analytical outputs, meeting the highest levels of trustworthiness, quality and value for users.
What you need to know about the IoD2025
For those unfamiliar with this dataset, there are some key concepts to be clear on from the outset. The IoD25 provides the most complete place-based insight into deprivation at the neighbourhood-level. The set of relative measures rank all 33,755 Lower-layer Super Output Areas (LSOAs) in England. LSOAs are a statistical geography produced as part of the 2021 Census. Each LSOA represents an average population of 1,500 people, roughly covering a similar area to a postcode. Finally, the Indices are designed to identify areas with relatively high levels of deprivation. The Indices are not a measure of affluence or of any absolute change in levels of deprivation over time.
The purpose of the Indices is to provide a consistent, accurate and robust measure of relative deprivation at a small area level across England. As a resource, the Indices feed into a wide array of analytical work across government, local authorities, academia, charities and third sector organisations. From community integration projects and models for public service funding allocation, to policies for improving local areas, the Indices help highlight disparities and identify how they might be addressed.
At a local level, the indices also provide a clear, consistent, and accessible tool to assess relative deprivation at a variety of geographic scales, enabling local stakeholders to identify priorities for improvement and work with communities to generate local solutions.
The webpage for the previous release (the IoD2019) is the most frequently visited across government. We’re hoping the IoD25 will top it!
Enhancing our methodology
This release’s methodology follows on from previous publications, retaining the same conceptual framework and model of multiple deprivation. However, the IoD25 has been significantly enhanced and updated following our 2022 user consultation, alongside extensive stakeholder engagement throughout its production.
The IoD25 is based on 55 separate data sources (termed ‘indicators’) organised across seven distinct domains of deprivation – income, employment, education, health, crime, barriers to housing, and services and the living environment. The majority of these are sourced from administrative data across Government.
The seven individual domains are then combined and weighted to calculate the Index of Multiple Deprivation 2025 (IMD25) – the official measure of relative deprivation in England. Supplementary indices measuring income deprivation affecting children (IDACI) and older people (IDAOPI) are also created. In total, the IoD25 comprises ten separate indices of deprivation.
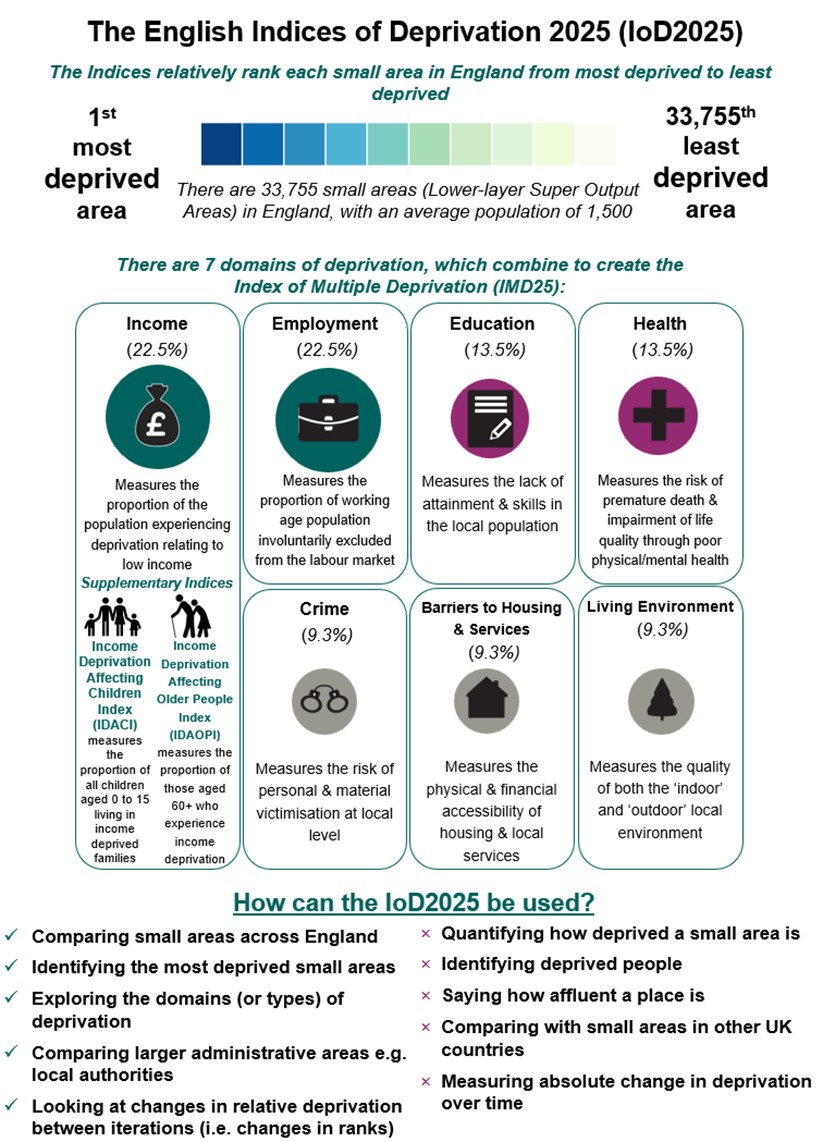
Image: A graphic illustrating the domains and guidance on how to use the IoD2025. This information is also available within the publication and the accompanying research report.
Working together to increase our insights
Alongside the Indices’ utility and impact across sectors, it’s also important to highlight the level of collaboration across government. Given the range of data incorporated, there is scarcely a Whitehall department which hasn’t been involved in some way – many producing bespoke datasets for inclusion, others engaging on development and changes, more still in using and augmenting to produce policy specific analysis.
It really is a collective effort – a great example of what can be achieved by working together.
Patterns of deprivation in the IoD2025
Across England, patterns of deprivation are complex. The most and least deprived neighbourhoods are spread throughout the country. As was the case in previous versions of the Indices, the IoD25 reveals concentrations of deprivation in:
- large urban areas such as Birmingham, Liverpool, Greater Manchester and parts of Teesside
- areas which have historically had large heavy industry manufacturing or mining sectors, such as Bradford, Nottingham, Blackburn with Darwin and connected rural villages
- coastal towns, such as Blackpool, Hartlepool and Hastings
- parts of east London
There are also pockets of deprivation surrounded by less deprived places in every region of England.
Although the Indices is designed primarily to be a small-area or neighbourhood measure of relative deprivation, LSOA level outputs are often aggregated and used to describe relative deprivation for higher-level administrative geographies, such as Local Authority Districts. To facilitate this, a range of summary measures are produced for larger areas.
Using one of these summaries, Middlesbrough, Birmingham, Hartlepool, Kingston upon Hull and Manchester rank as the Local Authority Districts with the highest proportions of neighbourhoods among the most deprived in England.
Detail on patterns of deprivation is available within the neighborhood deprivation analysis section of the publication, including a map which illustrates the distribution of the Index of Multiple Deprivation 2025 by LSOA.
Learn more
The IoD25 suite of resources includes:
- a national statistic release which presents headline findings and commentary on the IoD2025
- a research report which provides guidance on how to use and interpret the datasets and presents further results from the IoD25
- a technical report which presents the conceptual framework of the IoD25, the methodology for creating the domains and the overall IMD, the quality assurance carried out and changes since the previous release
- a rural report, produced in collaboration with DEFRA, considering how deprivation can manifest in rural contexts, how it may be measured, and how this may be improved in future
- our Local Deprivation Explorer, which supports users to view deprivation data for their area, explore comparisons across England using an interactive map, and download data
We’re always keen to engage with users on the work they are doing in this area and how the IoD25 might feed in, or how it’s already being used. If you’d like to discuss your work or have any questions about the Indices, get in touch.
Bowie Penney, Statistician at the Ministry of Housing, Communities and Local Government