Best practice for automated spreadsheets in R: Creating Accessible Spreadsheets with aftables

What is aftables?
aftables is an R package for creating accessible spreadsheets. aftables implements the Analysis Function guidance for releasing statistics in spreadsheets.
What does aftables do?
aftables automates text formatting and layout of spreadsheets to meet accessibility requirements. Aftables currently generates Excel workbooks using openxlsx.
How do I use aftables?
aftables is available to be installed from the Comprehensive R Archive Network (CRAN):
`install.packages(‘aftables’)`
The main functions in the aftables package are create_aftable() and generate_workbook(). The output of create_aftable() is passed into generate_workbook() to create an openxlsx workbook object, which can be passed into the openxlsx::saveWorkbook() function.
The create_aftable() function requires as arguments the contents of the cover sheet, contents tab, notes tab, and any number of data tables as lists or data frames. These should be generated and stored as objects in the R environment, though simple lists or data frames could be passed in directly.
This code prepares data from gapminder to use as the required arguments for the create_aftable() function:
# Preparing the gapminder data
# Population of European countries as of 2007, ranked and ordered
population_ranked <- gapminder |>
filter(continent == “Europe” & year == max(year)) |>
select(country, pop) |>
mutate(pop_rank = rank(-pop),
pop = number(pop / 1000000, accuracy = 0.1, big.mark = “,”)) |>
arrange(pop_rank)
names(population_ranked) <- c(“Country”, “Population [note 1]”, “Population rank”)
# Life expectancy at birth in European countries as of 2007, ranked and ordered
life_expectancy_ranked <- gapminder |>
filter(continent == “Europe” & year == max(year)) |>
select(country, lifeExp) |>
mutate(lifeExp_rank = rank(-lifeExp)) |>
arrange(lifeExp_rank)
names(life_expectancy_ranked) <- c(“Country”, “Life expectancy at birth”, “Life expectancy at birth rank”)
# GDP per capita in USD in European countries as of 2007, ranked and ordered
gdp_per_capita_ranked <- gapminder |>
filter(continent == “Europe” & year == max(year)) |>
select(country, gdpPercap) |>
mutate(gdpPercap_rank = rank(-gdpPercap),
gdpPercap = number(gdpPercap,
accuracy = 0.01,
prefix = “$”,
big.mark = “,”)) |>
arrange(gdpPercap_rank)
names(gdp_per_capita_ranked) <- c(“Country”, “GPD per capita [note 2]”, “GPD per capita rank”)
# data tables for cover sheet, contents and notes tabs
cover_list <- list(
“Analysis of gapminder data” = c(“Population”, “Life expectancy at birth”, “GDP per capita”),
“Contact” = c(“[Website](https://www.gapminder.org/)”, “[Email address](mailto:info@gapminder.org)”)
)
contents_df <- data.frame(
“Sheet name” = c(“Notes”,
“Population”,
“Life expectancy at birth”,
“GDP per capita”),
“Sheet title” = c(
“Notes used in this workbook”,
“Population of European countries in 2007, ranked”,
“Life expectancy at birth of European countries in 2007, ranked”,
“GPD per capita in USD of European countries in 2007, ranked”
),
check.names = FALSE
)
notes_df <- data.frame(
“Note number” = paste0(“[note “, 1:2, “]”),
“Note text” = c(“Population in millions”,
“GDP measured in inflation adjusted US dollars”),
check.names = FALSE
)
The other required arguments are tab titles, sheet types, and sheet titles. The optional arguments are notes explaining blank cells, custom rows, and data sources. These could be passed in directly or as simple vectors or lists. This code follows on from the code preparing the data above to create the other required arguments and calls the create_aftable() function:
gapminder_aftable <- create_aftable(
tab_titles = c(“Cover”, “Contents”, “Notes”, “Population”, “Life_expectancy”, “GDP_per_capita”),
sheet_types = c(“cover”, “contents”, “notes”, “tables”, “tables”, “tables”),
sheet_titles = c(
“‘aftables’ gapminder demo workbook”,
“Table of contents”,
“Notes”,
“Table 1: Population of European countries in 2007, ranked”,
“Table 2: Life expectancy of European countries in 2007, ranked”,
“Table 3: GPD per capita of European countries in 2007, ranked”
),
blank_cells = c(
rep(NA_character_, 6)
),
custom_rows = list(
NA_character_,
NA_character_,
NA_character_,
c(“The most recent data in this report is 2007. More recent data is available from gapminder”),
c(“The most recent data in this report is 2007. More recent data is available from gapminder”),
c(“The most recent data in this report is 2007. More recent data is available from gapminder”)
),
sources = c(
rep(NA_character_, 3),
“[Free data from United Nations and Gapminder](https://www.gapminder.org/data/documentation/gd003/)”,
“[Free data from Institute for Health Metrics and Evaluation and Gapminder](https://www.gapminder.org/data/documentation/gd004/)”,
“[Free data from World Bank and Gapminder](https://www.gapminder.org/data/documentation/gd001/)”
),
tables = list(cover_list, contents_df, notes_df, population_ranked, life_expectancy_ranked, gdp_per_capita_ranked)
)
gapminder_workbook <- generate_workbook(gapminder_aftable)
openxlsx::saveWorkbook(gapminder_workbook, file = “gapminder.xlsx”, overwrite = TRUE)
The output of create_aftable() is an aftable data frame, which is provided as the only argument to the generate_workbook() function. The output of the generate_workbook() function is an openxlsx workbook object which can be saved with the openxlsx::saveWorkbook() function, as in Figures 1 and 2.
Figure 1: Cover sheet of the gapminder example workbook
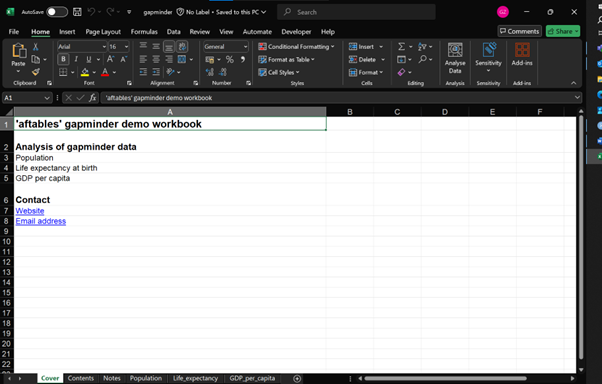
Figure 1 shows a cover sheet of the gapminder example workbook. Information displayed on the screenshot is as follows:
- Analysis of gapminder data (title)
- Population
- Life expectancy at birth
- GDP per capita
- Contact (title)
- Website (link)
- Email address (link)
Figure 2: Population table of the gapminder example workbook
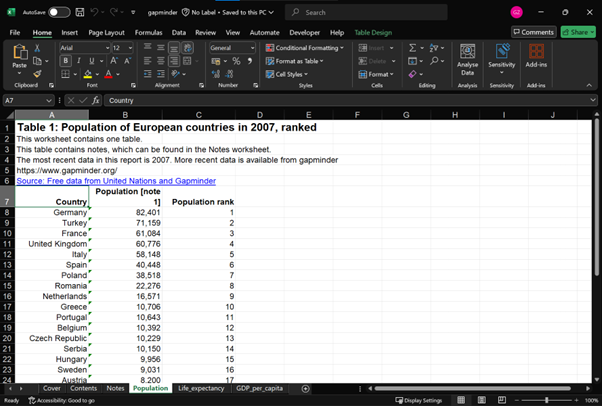
Figure 2 shows a table of population data from the gapminder example workbook.
Information displayed on this screenshot is as follows:
- Table 1: Population of European countries in 2007, ranked (title)
- This worksheet contains one table
- This table contains notes, which can be found in the notes worksheet
- The most recent data in this report is 2007. More recent data is available from gapminder
- Source: Free data from United Nations and Gapminder (link)
The cells below this information display three columns; a list of countries (column A), their population (column B), and their population rank (column C).
The accessibility check at the bottom of the screen indicated the workbook is “good to go”.
Who made aftables?
aftables was developed by Matt Dray, and is now maintained by the GSS Presentation Champions.
What’s next for aftables?
aftables was first released on CRAN in February 2025. The next major update will upgrade the package to use openxlsx2.
How can I help make aftables better?
If anything isn’t working, let us know and we’ll fix it. The best way to let us know is by raising an issue on the aftables GitHub page.
We would be happy to welcome you on board to the aftables development team. You can help us fix issues and add more features to aftables.
What if I have more questions about aftables?
We welcome any questions, feedback, or new ideas. Email PHA-OHID@dhsc.gov.uk with “GSS Presentation Champions: aftables” in the subject line, or submit a github issue.
Zachary Gleisner