
The scope of this guidance
This guidance outlines the main steps to be taken when protecting outputs from surveys in considering disclosure control while:
- allowing different solutions to be developed for different datasets
- taking into account detailed risk assessment and the latest disclosure control methods
Methods of disclosure control are discussed for social and business surveys as well as subsamples. The guidance looks at the main steps to follow to produce outputs which balance confidentiality and utility for a range of outputs.
Risk assessment for data in tables
One major distinction between the risk assessment of tables created from survey data and tables created from administrative data is the consideration of ‘response knowledge’. This refers to the consideration that someone looking at the data may know a particular person or case is in the dataset.
In surveys, the sample size is usually a small percentage of the population, and someone looking at the data may have private knowledge that a particular person or business has responded. The cell counts are more likely to be small, which introduces a high risk that a person could be identified in the data.
Administrative data, or ‘admin data’, usually consist of most of the eligible population, which means someone could assume that an eligible person or business is in the dataset. Although the cell counts are usually high, any small counts can lead to a high risk that a person or business could be identified.
For further advice please contact the Statistical Disclosure Control Expert Group by emailing SDC.Queries@ons.gov.uk.
Sample survey data are defined as information collected from a sample of the population, often containing a very large number of variables. The percentage sampled is often small, typically less than 1%.
There are two main types of surveys carried out by the Government Analysis Function:
- business surveys, which are often mandatory
- social surveys, or household surveys, which are not mandatory
Legislation and governance for outputs published from survey data
As with administrative data, there is legislation that applies to data published from survey data.
The piece of legislation most relevant to ONS, data confidentiality and statistical disclosure control is Section 39 of the Statistics and Registration Service Act (SRSA)(2007). This defines personal information as data which could reveal the identity of a person or organisation, or any private information relating to them, through being:
- specified in the data
- deduced from the data
- deduced from the data when taken together with any other published information
Under this legislation it is an offence for ONS staff to disclose any personal information, unless one of the exemptions to Section 39 applies. This is relevant as ONS surveys are conducted on behalf of the UK Statistics Authority (UKSA), and all outputs are subject to Section 39 of the SRSA.
Surveys carried out by other departments will generally be governed by other legislation or statutory provisions. All surveys containing personal information are subject to the Data Protection Act (DPA) (2018), which is the implementation of the UK General Data Protection Regulations (GDPR).
Official Statistics must comply with the confidentiality regulations of the Code of Practice for Statistics. There is also a code specific to Government Social Researchers (GSR) which discusses the legal and ethical aspects of research.
Social or household surveys
For all household surveys, the public statements made about protection of confidentiality define a common law duty of confidence with which the Analysis Function (AF) must legally comply. The implications of this are that any pledges or promises made to respondents must be fulfilled. Breach of the common law creates a right for the individual respondent to sue for damages.
Subsamples
The earlier legislation for protection of confidentiality in social or household surveys applies to tables created from subsamples, such as the Longitudinal Study (LS). By ‘subsamples’ we mean a further sample taken from survey respondents. There is a subtle difference between surveys and subsamples that is important in disclosure risk assessment. Response knowledge may not be inferred simply because a respondent is known to be in the sample collected. The respondent may or may not be in the subsample.
Business surveys
Business surveys carried out by the ONS operating within the United Kingdom are governed under the Statistics of Trade Act (1947). Under the Act, participation in the survey is compulsory, and confidentiality requirements that relate to published data are specified in Section 9 of the Statistics of Trade Act. This states that tables that would disclose any information relating to an individual business should not be published unless there is express consent in writing from that business. Equally, data that would reveal the exact number of respondents contributing to a cell should not be published if there are fewer than five contributors.
Disclosure of data received from HMRC under the Value Added Tax Act (1994) relating to individual undertakings is also prohibited without the consent of that undertaking. Where data are received from HMRC under the Finance Act (1969) they cannot be disclosed at all.
Surveys of businesses not run by the ONS are governed by the:
- Data Protection Act (2018)
- Freedom of Information Act (2000) – this Act is particularly relevant to these types of surveys
The Data Protection Act (2018) replaces the 1998 Act and is the implementation of the General Data Protection Regulation (GDPR), which was updated to UK-GDPR on the UK’s exit from the European Union. This controls how personal information is used by organisations, businesses, and the government. The government must make sure the information collected is used fairly, lawfully, and transparently.
The 2018 Act has been updated from the 1998 Act to include modern methods of data collection. It is still applicable to ‘personal data’, but with special categories including genetic and biometric data.
The Code of Practice for Statistics provides producers of official statistics with the detailed practices they must commit to when producing and releasing official statistics. It states in section 4.5 (page 20) that data producers must “…apply appropriate disclosure control methods before release” and “protect the confidentiality of individual and business information when producing statistics”.
Statements to respondents
The ONS has a commitment to all survey respondents. The Respondent Charter for Business Surveys states a commitment to:
- keep respondents’ information secure and confidential
- make it as easy as possible to contribute
- value respondents’ time and contribution
- communicate with respondents and listen to their views
There is also an equivalent charter for respondents to household and individual surveys.
Trust of respondents
The AF relies on the co-operation and goodwill of respondents to provide the data that are the basis of our official statistics. This remains true, even where business surveys are compulsory under the Statistics of Trade Act.
The Code of Practice states data producers should “clearly explain their rights and how their information will be used and protected when collected for statistical purposes” (Section 4.3, page 19).
Similarly, Principle 4 of the Government Social Research (GSR) Ethics Guidance states that “participation in research should be based on specific and informed consent”, whereby those taking part in research are informed about the major details of the project before they participate.
An important part of maintaining that trust is ensuring that identifiable information is held securely and not revealed in published outputs. Some data collections by business surveys are commercially sensitive and recent data may have high value to competitors. If respondents do not trust us to keep their data safe they may be reluctant to respond, or may supply poor quality information.
Samples and population
There is a degree of protection supplied by the data being a sample. An intruder may know a person in the population has specific characteristics, but there is no guarantee they are in the sample unless:
- the person has informed the intruder
- the intruder has discovered this in some other way
People who try to identify individuals, businesses and other units – either on purpose or inadvertently – are known as intruders (or attackers). Intruders can be:
- motivated – such as journalists looking for a story about someone
- non-malicious – such as a friend or colleague who sees an output and realises they can identify someone in the data (this is known as spontaneous recognition)
Response knowledge is important here. If an intruder has knowledge that a person has taken part in a survey and is within the data, they may be tempted to search the resulting tables to try and identify them or discover a related attribute. Without this knowledge, a person in the survey has another layer of protection.
Assessing the disclosure risk
There is no single approach that can be taken to achieve disclosure protection. When you are making decisions on whether outputs pose a disclosure risk, context is especially important.
Tables created from social surveys
Determining the users’ requirements
Many tables are produced from social surveys and these are used by National and Local Government for policy purposes, as well as by academic researchers and the general public. It is a requirement that these tables are as useful as possible for users, whilst also maintaining the confidentiality of the respondents.
Standard tables are produced following discussion with users to ensure the outputs are relevant to a wide range of policy and research purposes. Disclosure control should have as little effect on the quality of these outputs as possible, while still being sufficient to protect confidentiality.
Ad hoc tables can also be requested at various levels of detail, and these require individual consideration with respect to statistical disclosure control.
Considering the characteristics of the data and proposed tables
This section of the guidance relates only to social survey data derived from samples of the population. Most survey samples have a small sampling fraction of less than 2%. Some may have a medium sampling fraction of 2% to 5%, or a large fraction of more than 5%.
There are many different surveys with different aims and different user groups collecting a very wide range of variables, but all share certain similarities in that response is voluntary and the sampling rate is usually low.
Table properties
Common demographic variables include:
- age
- sex
- ethnic group
- marital status
- primary economic activity
Household variables typically include:
- size of household
- household composition
- family type
Outputs are often expressed as frequency tables (as counts and percentages), but may also include magnitude tables where each cell displays a total or average for the households or people in that subgroup. Examples are average household expenditure by tenure and total wealth for households or people by age or economic activity.
For smaller surveys such as the Living Costs and Food Survey (LCFS), tables are published at a high geographic level (usually Region). For large surveys such as the Labour Force Survey (LFS), tables are produced at lower geographic levels (usually Local Authority District).
Demand for publishing at a range of geographies becomes more common once users know it is possible. Publication intervals may be monthly, quarterly, annual, or one-off and ad hoc. Requests for non-standard tables may relate to specific areas or ask for greater detail in one or more variables.
Sample design
Sample designs can vary. For example, the LFS is an unclustered sample of addresses but when the individual dataset is analysed the cluster areas will be households. Clusters can also be:
- geographical areas — such as in LCFS
- establishments — such as schools (an example is the Oral Health Survey of 5 year old children, 2017)
The Oral Health Survey uses a stratified sampling method which takes school size into account. All children in the small schools are sampled, along with a proportion of those in the larger schools.
Most AF surveys use systematic sampling, whereby units are sampled at regular intervals through the sampling frame. To apply this standard, the sample fraction must be small (less than 2% of the target population). The sampling fraction must also be small for any identifiable sub-groups of the target population. There may be instances where the sampling fraction is greater than 2%. These could include specific Local Authorities with small populations where a larger sample is necessary.
Extracts from administrative data sources could be larger than 5% of the target population. This guidance contains advice on High Sampling Fractions, but there are no definitive rules on sample design. The Survey Manager or equivalent will need to make the final decision.
Weighting
Generally, social surveys use post-stratification or calibration weighting to adjust for non-response and under-coverage. Weights produced through this methodology tend to be quite variable and often unique for each household. Where surveys have not adopted this approach the survey may still use weights to adjust for selection probabilities or non-response, but the weights tend to be less variable and may be the same for several households. Where weights are not variable (perhaps where they are used solely to adjust for selection probabilities) extra care should be taken, particularly if tables are based on variables used as weighting classes or strata. These variables could include Region or age groups.
If an intruder can gain information about the size of the weights used (either directly from a technical appendix, or indirectly from published response rates) then the output manager should adopt the disclosure control standard for unweighted data.
Likely disclosure risks
Sampling provides some protection for sample survey data. Weighting can also provide some protection, when it is used. Any randomly selected unit has a probability of not being included in the sample, and this probability depends on the sampling fraction.
It may still be possible to identify a respondent in the sample. This section sets out the disclosure risks that may be present in the data, which need to be protected. We first consider disclosive situations as intruder scenarios and then show which cells in a table present a disclosure risk.
We identify three types of disclosure risk:
- attribute disclosure — this refers to disclosure of information about a statistical unit, not already in the public domain
- identity disclosure — this refers to identification of a statistical unit
- self-identification
Attribute disclosure
In most situations, a person must have already been identified in the data for attribute disclosure to occur. Typically, this happens in one of the following ways:
- intruders with some external knowledge of the population can identify sample respondents who are unique or rare (known as identification of ‘population uniques’) — this becomes more likely the smaller the population size becomes, for example in smaller geographic areas or a minority ethnic group
- intruders can identify a respondent if they know the respondent is in the sample and they are unique — this is known as identification by response knowledge from sample uniques
- respondents in the sample may identify another respondent with the same characteristics as themselves (identification by response knowledge from sample pairs)
This is the main reason for reducing the risk of identity disclosure. Also, the outputs should not allow an intruder to identify a statistical unit, even if all the details about that unit in the table are already known to the intruder.
The concept of identification carries an element of uniqueness: the association of a name with a cell value. Attribute disclosure includes ‘inferential disclosure’, which is where information about a statistical unit can be inferred with a high degree of confidence.
These types of disclosure risk are more likely to be present under ad-hoc requests, as standard tables should be designed to ensure that disclosive outputs occur infrequently. However, all tabular outputs should be assessed for possible confidentiality breaches.
Self-identification is not usually considered a disclosure risk for most social surveys. But you should be cautious if there are highly sensitive variables that might cause risk of substantial damage or distress to a respondent who was able to identify themselves. For some surveys perception of disclosure from self-identification may be an issue. This means that any intruder scenario that leads to identification of a respondent presents a disclosure risk.
A person does not need to be identified for group attribute disclosure. Here all respondents in a row or column will be in one cell. New information can still be attributed to all in the group, so there is an element of risk, but further knowledge about a respondent will be needed in order to identify them. For example, if an intruder found that all people in the survey in a defined age group had very poor health they could make use of this information, but they would be unable to identify an individual without further knowledge.
Elements of outputs that pose a disclosure risk
The intruder scenarios depend on the type of sample. Response knowledge can only occur if the intruder or respondent is aware that a person is in the sample.
If there is a single respondent contributing to a cell, then the respondent is a sample unique for the variable categories that define the cell. They may also be a population unique, though this is much more difficult to establish for sample data. In certain surveys the ‘population’ sampled may only be a subset of the actual total population.
The disclosure risk in any published table will increase as the sampled population decreases. If the sampled population is a sensitive subset, the release of any disclosive data could be especially problematic. Even learning that someone is in the sample may allow an intruder to find out something new and sensitive about them.
Uniqueness may lead to identification by an intruder. For example, there may be only one 83-year-old from a minority ethnic group in the sample, and they may be identified. For identification to occur, the variables defining the cell must be identifiable. That is, they must be known to third parties to enable them to be used to identify a unit. The identification can then lead to disclosure of further information.
Additionally, respondents in the sample may identify another respondent with the same characteristics as themselves. This would be identification by response knowledge from sample pairs. This would mean that a cell with two respondents contributing to it may also pose a disclosure risk.
Magnitude tables
For magnitude tables, the value supplied by the respondent can be revealed through identification, along with knowledge of the sample weight. Magnitude tables are relatively uncommon in social survey data. But there are examples, such as the amount spent on specific items in the LCFS. Magnitude tables can also be produced from the Wealth and Assets Survey (WAS), which has many variables relating to finance.
If the cell that identifies the respondent is also further broken down by another variable, more information about the identified respondent is revealed. This may occur in a table when a marginal sub-total has only one contributing respondent which allows identification, and the internal cell reveals a further attribute.
When there are multiple tables produced from the same microdata, any cell with one contributing respondent in a particular table may appear in another table broken down by a further attribute. The other table could have been previously produced, or it may be a table that is created in the future. Whenever flexibility is required for multiple tables from the same microdata, all cells that lead to identification are a disclosure risk to protect against attribute disclosure. This is the case for most social survey data.
Unsafe cells in magnitude tables are those which pose a risk of disclosure. These are defined as cells where one or two respondents contribute to the published value, or where there is one or more dominating contributor. Low counts published from a social survey sample would be of low quality with much uncertainty surrounding the true value.
Unsafe cells may be present in a table but may also be the result of differencing between two tables. Differencing is only a disclosure risk for small samples where unweighted values are provided. You can find further discussion on disclosure concerns relating to weighted and unweighted values in the section of this guidance titled “Selecting disclosure control methods”.
Cells are only unsafe if an intruder can determine with some certainty that one or two respondents contribute to the cell.
Elements of outputs that do not pose a disclosure risk
We do not consider that cell counts of zero would normally be a disclosure risk for sample data in the way they may be for population data. Zeros in population data allow us to say that no-one in the population has that attribute. A zero value from a small sample does not allow anyone to infer this, since there may be population units with those attributes who were not sampled. This means that attribute disclosure without identification is not considered a disclosure risk.
Disclosure by differencing occurs when comparison of two or more tables reveals information that is not available from any single table. For example, the difference in counts between a table of age with an age group of 15 to 19 and one with an age group of 15 to 18 would reveal values for 19-year-olds. Differencing is of less concern with weighted estimates from household surveys, since the weights can provide enough uncertainty to protect confidentiality — unless the weights are broadly similar.
When the intruder does not have response knowledge, cells based on two or more respondents are not considered a disclosure risk. This is because small sampling fractions make it highly unlikely that an intruder could correctly identify more than one person in the population.
When the intruder may have response knowledge, cells with three or more units are not considered a disclosure risk. This is because it is assumed that respondents are unable to identify more than one other respondent. This is reasonable for most surveys, but may not be true for some cluster designs, or when very valuable information collected in the survey leads to a highly motivated intruder.
Legal, ethical and trust considerations
The 2018 Data Protection Act and Code of Practice for Statistics have already been discussed in this guidance. This section contains further discussion of legal, ethical and trust considerations.
When establishing whether confidentiality protection is required for a particular statistic, you should consider:
- public trust and cooperation
- legal rights and obligations
- national and international standards for statistics
This will help determine acceptable and unacceptable disclosure risks.
The production and use of statistics depend on the co-operation and trust of citizens. Such trust cannot be maintained unless the privacy of personal information is protected (and perceived to be protected). Failure to respect privacy might result in harm or distress to a specific person. Sensitive personal records, therefore, need to be strictly confidential. On the other hand, there is a legitimate public interest in having ready access to aggregate or summary statistical information.
The legal framework covering the use of personal information as defined by the SRSA and DPA is complex. When such information is transformed into statistics, the legal framework is much simpler. The statistical information can be widely and freely used provided confidentiality protection has been applied such that it is no longer likely that the information can be related to specific identifiable people.
When the information in a statistic does not relate to an identifiable person (either on its own or in combination with other information likely to be available), there can be no breach of the duty of confidence owed or any conflict with data protection or human rights legislation.
Information available in the public domain is not necessarily risk-free when presented in a table or as another statistic. Statistical disclosure control methods may change the data or the design of the statistics, or a combination of both. They will be deemed sufficient when the guarantee of confidentiality can be maintained.
Statisticians or researchers should have no interest in the individual statistical unit, other than to distinguish one unit from another for statistical purposes. This could include conducting data matching or linking exercises for statistical purposes, where identified data are essential for quality reasons.
In contrast, an intruder is someone who — for whatever reason — wishes to distinguish one statistical unit so they can treat it separately or differently from the other statistical units in the dataset, for a non-statistical purpose. Producers of statistics should be aware that intruders may use other public and private sources of information in their attempt to identify a person or other member of the published table.
Phrases related to the word ‘identity’ are used frequently in legislation concerning disclosure control and data confidentiality. The 2018 Data Protection Act defines an “identifiable living individual” as a living person who can be identified (directly or indirectly) in particular by reference to both direct identifiers and factors specific to the physical, physiological, genetic, mental, economic, cultural or social identity of the person.
Data relating to an identifiable living person are defined as personal data. The Act states that it is unlawful to obtain personal data without consent of the data controller.
Selecting disclosure control methods
Where required, disclosure control methods can be used to reduce the risk by modifying the unsafe cells. In choosing the method, one should consider the complexity needed to implement it, as well as the uses to be made of the resultant information.
Cell suppression is the recommended protection method. The exact method will depend on the sample design and estimation.
There will be uncertainty over how many respondents contribute to a cell when final sample weights used in the estimation are sufficiently variable. This is especially true if the weights are unknown. There will also be high sampling error associated with a very small number of contributors, which means that sufficient protection can be achieved by suppressing estimates for unsafe cells where only weighted estimates are published. Secondary suppression is not required.
More information about cell sizes can be deduced when unweighted sample base numbers are published. If essential, unweighted sample base numbers should be modified to ensure it is not possible to infer only one or two contributions to a cell. There are several ways of doing this. The unweighted sample base numbers can be:
- conventionally rounded to base 10 — this is preferred over base 5, since a zero using base 5 would indicate that a cell is a 0, 1, or 2
- probabilistically rounded — this is where numbers are rounded to a round value with certain probabilities which depend on the distance from the original value to the round value
- modified through controlled rounding — this is where numbers are rounded in such a way that the additivity of the table is preserved
Each of these methods could increase the possible range of values. Alternatively, cells can be combined with larger cells and one figure given for both. Greater protection is given to the table if genuine zeros are not differentiated from a non-zero count rounded to zero. However, there is a chance that structural zeros (which are placed in cells where it is impossible to contain any cases) may be defined as a true zero.
Table design is a possible method to remove unsafe cells if weights are known, or unweighted estimates are produced. Variable categories should be combined, or variables removed until only safe cells remain.
Disclosure risk increases with smaller geographies. For most surveys, outputs should be for large geographical areas. For example, regions, or Local Authority Districts in cases of larger samples. The standard reflects the fact that most tables produced below this level contain a high proportion of disclosive cells (containing a 1 or a 2). A table with many suppressed cells would be of limited use.
Applying the chosen method
Unusual circumstances
You should consider whether there are any unusual circumstances relating to the data that would mean other cells are unsafe and apply appropriate protection. The simplest methods of protection involve raising the minimum cell size, or increasing the level of geography
As the number of respondents in a cell increases, it rapidly becomes much less likely that a person may be identified. Examples of unusual circumstances are:
- small sub-populations for easily identifiable variables such as ethnic group, occupation, religion, country of birth — especially if the sample design includes clusters (geographic or other variables)
- other identifiers that could be used in combination with standard area classifications to identify small geographies — for example, urban or rural indicators
- variables that may be considered highly sensitive or valuable to an intruder
Geography
A minimum population size of 50,000 should be used as a general indication of equivalence to Local Authority District geography. Note that while the City of London and Isles of Scilly are defined as Local Authorities, they must be combined with other geographies to meet the minimum size.
Percentages
Percentages may be released, provided it is not possible to deduce where only one or two units have contributed to the cell. For example, small percentages may be rounded to zero. Percentages must be rounded sufficiently, depending on the sample size on which they are based. It is essential that the underlying cell counts are not released.
Output managers should ensure that the underlying count is not published in the same table, and it is not available elsewhere in the same publication.
High sampling fractions
If the sample design includes high sampling fractions for some sub-groups (such as ethnic groups, or areas), then disclosure control should be applied as it would be for a census or other whole-population data source.
Higher level units
The statistical units on which a table is based may belong to another higher-level unit, for example an establishment like a school or prison. If this higher-level unit is unique in the population for a combination of characteristics, it may be identified by an intruder. For example, if there is only one private school in a local authority it would be easily identified in a dataset. The existence of the private school may be public knowledge but the characteristics of the population within may not be.
It may also be possible to identify the establishment in a table where counts of people in a cell all belong to the same establishment. This means protection needs to be applied to the higher-level unit, as well as the individual unit.
Cluster sampling
Care should be taken with cluster sampling, as the clusters may help in identification with a higher chance of response knowledge. For example, a cluster sample design based on birth dates will be close to a simple random sample, except for biological twins and higher multiple births. Then some cell counts of 2 or higher may be a disclosure risk if they consist only of multiple births.
If clusters are institutions (schools, for example) and the output unit is people (or pupils) there is a higher risk of disclosure. Firstly, pupils are likely to know more than one other respondent in the sample because they may have completed the questionnaire in the same room.
Secondly, many people other than the respondents themselves may know that the cluster was sampled. For example, teachers, parents and education administrators at local education authorities may know that a specific school was sampled. Identification of the cluster unit may be disclosive by itself, or it may help intruders identify people.
If all units in the cluster are sampled, for example, everyone within a household, then identification of the cluster would identify the units within the cluster.
Implementing your selected method, or methods
This guidance will allow data providers to set disclosure control rules and select appropriate disclosure control methods to protect different types of published tables of statistics based on surveys. The most important consideration is maintaining confidentiality, but these decisions will also accommodate the need for clear, consistent and practical solutions that can be implemented within a reasonable time and using available resources. The methods used will balance the loss of information against the likelihood of information being disclosed. Data providers should be open and transparent in this process. All decisions should be documented, along with the whole risk assessment process so these can be reviewed.
There is also a relationship between disclosure risk and disclosure impact. What is considered a sufficient level of uncertainty will differ depending on the sensitivity of the release and the impact of a disclosure. This is difficult to quantify, and decisions should be taken by those most familiar with the data.
Impact on quality
The Code of Practice states on page 6 that “If organisations only focus on the production of the numbers, they risk not fulfilling the practical utility of the statistics and may reduce confidence in the organisation itself and their outputs” (following from the UN Fundamental Principles of Official Statistics). One of the 3 core principles of the code is ‘Quality’, which is defined on page 7 as “… using suitable data and appropriate methods to produce reliable statistics that meet user needs”.
There is a relationship between the quality of an output and the application of disclosure control. Cells with low counts are sometimes not released due to poor quality as they have high sample error. Where low counts are not released, disclosure control is not needed. This means it has little impact on the detail and quality of the published data.
As a rule, if over 60% of the table is suppressed to protect confidentiality, you should consider not supplying the table due to quality concerns. In those situations, it would be helpful to use a higher geography or a less detailed classification on one or more of the variables.
Tools
Where the disclosure control method relies on table design it should be part of the normal production process. The primary cell suppression is easy to implement in any software and may also be combined with suppression of poor quality estimates, if these are used. Primary suppression of a table can be implemented using a program such as Tau Argus.
If conventional rounding is used for unweighted sample base numbers, specialist software may not be necessary.
Standard wording
There are several standard statements to include with release of data.
When you are informing data users about the confidentiality protection method, you should say:
“Cells in a table based on a small number of respondents are more likely to breach confidentiality and are also likely to be unreliable. Confidentiality protection is provided by suppressing the values for unsafe cells and by releasing only weighted estimates. Information on the exact number of sample respondents is restricted.”
When you are informing data users about the impact of disclosure control on the quality of data, you should say:
“The effect of disclosure control on the quality of the data released is very small because data that appear disclosive and are therefore protected may also be of low quality.”
Where suppression has been used and you need to use footnotes, you should say:
“[symbol] Cells have been suppressed to protect confidentiality.”
‘c’ is the standard symbol used.
Case studies for tables produced from social surveys
Table A1.1 has counts for specified ethnicities for a range of age groups.
Table A1.1: Counts by Ethnic group and Age for males in a specified Local Authority
| Age 16 to 24 | Age 25 to 34 | Age 35 to 55 | Total | |
|---|---|---|---|---|
| White | 2,110 | 3,246 | 2,643 | 7,999 |
| Mixed | 124 | 356 | 217 | 697 |
| Asian or Asian British | 213 | 267 | 164 | 644 |
| Black or Black British | 43 | 58 | 46 | 147 |
| Chinese or Other | 8 | 21 | 25 | 54 |
Table A1.2 is a request for further breakdown of the “Chinese/Other” ethnic group by income, and publication is likely to lead to self-identification by the person in the lowest income band. Other people in the sample from this ethnic group may also try to identify the person in the lowest income band.
Table A1.2: Income in the same Local Authority, age 16 to 24
| Income Band Low | Income Band Medium | Income Band High | Total | |
|---|---|---|---|---|
| Chinese or Other, aged 16 to 24 | 1 | 3 | 4 | 8 |
Two possible options for protection are to suppress:
- all the cells except the total in Table A1.2
- the total and corresponding internal cell in table A1.1
The decision as to whether suppress that cell would depend on:
- whether the number of sample respondents was also to be released, or could be very easily derived
- whether response knowledge (or knowing a given person is in the sample) is essential to find out the information
- the sensitivity of the information – this is informed by the risk of harm or distress to the person concerned
- whether it would be possible to find out anything that the intruder would not have known or been able to find out very easily from other sources (such as personal knowledge of their employment characteristics if, for example, they worked in a very ‘publicly visible’ occupation)
This does raise an interesting and tricky issue of “1s” in tables. If there is no attribute disclosure and self-identification is the only risk, we need to consider the sensitivity of the information. You should consider whether the person concerned would feel exposed. They may, for example, feel vulnerable to other people identifying them, or worry about being targeted by a journalist. This is related to the Data Protection Act (2018) and considering the risk of harm or distress to the individual.
In this instance, we might suggest being cautious with the ethnic group variable as it is a sensitive characteristic and warn that income is seen to be sensitive by some people (though it does not appear in the DPA or UK-GDPR). Self-identification is really the only risk here, though the impact on the person that identifies themselves in the data as the lowest paid may be considerable.
Table A2.1 shows an example where it can be deduced with reasonable probability that the number of contributors to the cell percentage (or the percentage of unemployed men aged 65 years and older who consulted a GP in the 14 days before the interview) is 1.
Table A2.1 Percentage of unemployed men who consulted a GP in the 14 days before interview
| Age 16 to 44 | Age 45 to 64 | Age 65 and over | Total | |
|---|---|---|---|---|
| Unemployed men | 11 | 16 | 20 | 12 |
| Unweighted base | 152 | 57 | 5 | 214 |
It is likely that an intruder could work out this information, although the weighting does introduce an amount of uncertainty. The decision to protect this information might hinge on the chance of someone being able to identify the person using response knowledge, and the sensitivity of the information. In this case, there are two variables that could be considered sensitive: the fact that the man is unemployed, and that they have consulted a GP.
There is an almost zero chance of being able to identify the person without already knowing all the information present, but it is not unreasonable to protect that cell in this case. There is also an issue with data quality, as the percentage is based on only 5 people – but that is at least transparent to the user in this table.
The table should be protected by suppressing the unsafe cell and rounding bases to base 10 (as shown in table A2.2) or collapsing categories.
Table A2.2: Percentage of unemployed men who consulted a GP in the 14 days before interview
| Age 16 to 44 | Age 45 to 64 | Age 65 and over | Total | |
|---|---|---|---|---|
| Unemployed men | 11 | 16 | c | 12 |
| Unweighted base (rounded) | 150 | 60 | 10 | 210 |
Note that in Table A2.2 the bases are no longer additive. Where percentages are calculated from a small base, these rounded base values should be italicised for quality purposes to indicate this.
Alternatively, instead of suppressing the percentage value, we could remove the unweighted bases (as shown in table A2.3).
Table A2.3: Percentage of unemployed men who consulted a GP in the 14 days before interview
| Age 16 to 44 | Age 45 to 64 | Age 65 and over | Total | |
|---|---|---|---|---|
| Unemployed men | 11 | 16 | 20 | 12 |
It is important to note that table A2.3 does not make the data quality issues transparent, as the previous tables do.
In the following example, table A3.1 has disclosed that there is only one household in the sample with six or more people working. While this is not of much interest in itself, this information could be used in combination with other outputs to disclose further information about the household, particularly if this categorisation was cross-tabulated with any other variables. This example shows how protection is required at the individual and the household level.
Table A3.1: Characteristics of households based on weighted data (unsuppressed and disclosive)
| Number of persons working in household | Grossed number of households (thousands) | Households in sample (number) |
|---|---|---|
| No person | 9,300 | 2,083 |
| 1 person | 7,090 | 1,606 |
| 2 persons | 8,020 | 1,323 |
| 3 persons | 1,370 | 371 |
| 4 persons | 330 | 45 |
| 5 persons | 30 | 14 |
| 6 or more persons | 10 | 1 |
In this example it is unlikely that suppressing the row output for six or more people would be sufficient, since it is likely that the total number of (unweighted) households in the sample is known. If so, the suppressed figures could be easily calculated. This means it would be sensible to top code the number of people working in the household, either to:
- five or more people
- four or more people – if some statistics are available elsewhere for households with five residents
Top coding to four or more people removes almost all residual risk of disclosure by differencing.
Table A3.2: Characteristics of households based on weighted data (categories combined and non-disclosive)
| Number of persons working in household | Grossed number of households (thousands) | Households in sample (number) |
|---|---|---|
| No person | 9,300 | 2,083 |
| 1 person | 7,090 | 1,606 |
| 2 persons | 8,020 | 1,323 |
| 3 persons | 1,370 | 371 |
| 4 persons | 370 | 60 |
Alternatively, all base numbers could be rounded to base 10. This would be effective as long as the true figure cannot be calculated from the weighted number of households figure.
Table A3.3: Characteristics of households based on weighted data (base figures rounded and non-disclosive)
| Number of persons working in household | Grossed number of households (thousands) | Households in sample (number) |
|---|---|---|
| No person | 9,300 | 2,080 |
| 1 person | 7,090 | 1,600 |
| 2 persons | 8,020 | 1,320 |
| 3 persons | 1,370 | 370 |
| 4 persons | 330 | 50 |
| 5 persons | 30 | 10 |
| 6 or more persons | 10 | 0 |
In the actual publication the table is published up to 4 or more people with the sample numbers rounded to base 10.
Tables created from subsamples
Determining users’ requirements
The main users of subsamples – and hence subsample tables – are researchers who access microdata either in a safe setting within ONS, or under licensed access agreements. One example of such microdata is the ONS Longitudinal Study (LS), which contains linked census and life events data for a 1% sample of the population of England and Wales. Examples of uses from the LS include studies of mortality, cancer incidence and survival, fertility patterns, and of change between censuses. Outputs are produced by users from the microdata for publication or to aid research.
You can access subsamples of microdata from England and Wales census 2021 on the ONS website.
The secure microdata are available through the secure data laboratory where outputs are checked before export and release.
Considering the characteristics of the data and proposed tables
The types of tables produced and the uses of the data depend on the source data. The ONS examples mentioned previously in this guidance are subsamples from several England and Wales censuses, and the LS. These all produce tables of counts, which are usually unweighted.
The LS and the secure census microdata files contain very detailed data and are accessed only within ONS safe settings by Accredited Researchers. All outputs are checked by ONS staff before they are released.
There are two other ONS census subsamples.
Safeguarded microdata files
These consist of random samples of up to 5% of people in the 2001, 2011 and 2021 Census output databases for England and Wales. These files are available to download from the UK Data Service under an End User License. The microdata files have been modified using disclosure protection methods to ensure the microdata are considered non-disclosive under the conditions of the License. No further protection is required for tabular outputs. These include:
- a file at the region level
- a file at a grouped local authority level – this is a lower level of geography but the file contains less detail than the region file
Microdata teaching file
This contains 1% of census person records in England and Wales and was created for training students. Considerable disclosure control has been applied here to render the disclosure risk negligible, and there is not enough detail for practical analysis. The open licence data have almost universal access with only the most basic restrictions on use.
Microdata from the census follow a stratified systematic sample with the same – or very similar – selection weights across strata. The LS is a cluster design where the clusters are four birth dates (day and month).
The sampling introduces sample error that is not present in the source data. Data users are generally given sufficient information about the sample design to allow accurate calculation of sample errors. There is no additional non-response due to the sub-sampling, and (apart from sample error) data quality of the sample depends on the quality of the source data.
Likely disclosure risks
Intruder scenarios
As with social survey tables, the most likely intruder scenario occurs when sample respondents who are unique or rare in the population may be identified by an intruder with some external knowledge of the population.
This becomes more likely as the size of the relevant population decreases, for example in smaller geographic areas, or for a minority ethnic group.
Elements of outputs that pose a disclosure risk
Cells where one respondent contributes to the published value are unsafe. It is population uniques, rather than all sample uniques, that are disclosive.
However, in the current applications of census samples and the LS a conservative view is taken that cells of size 1 are assumed to be population uniques, unless shown otherwise. This approach is justified by the:
- very detailed and extensive information about people that is made available to researchers
- high value placed on maintaining the trust of census respondents
It is also often difficult for a data controller to detect where any one sample unique is also a population unique.
These unsafe cells may be present in a table but may also result from differencing between two or more tables.
As subsamples are usually unweighted, there is no extra protection offered by weighted estimates.
Elements of outputs that do not pose a disclosure risk
Zero cells do not normally create a disclosure risk in small subsamples as they can with population data. Zeros in population data allow users to say that all others in a row or column do not fall into the category of the zero cell. A zero value from a small sample does not allow users to infer that anyone in the population has those characteristics.
Cells of size 2 do not normally constitute a disclosure risk. Without respondent knowledge there is no risk from sample pairs, and small sampling fractions make it highly unlikely that an intruder could correctly and confidently identify more than one person in the population. However, care should be taken if clusters are sampled, since knowledge of the cluster could help identify all sampled units within the cluster.
There is no disclosure risk from response knowledge, since the membership of the sub-sample is not known to respondents or anyone else.
Where tables are published from the same sample from which the subsample is taken, there is a risk that those published tables could help identify subsample members who are population uniques. This can happen if the published table shows a cell count of 1 in a combination of characteristics held by a member of the subsample. This increases the risk of both identification and attribute disclosure, given the other variables available.
Legal, ethical and trust considerations
Relevant Acts along with the Code of Practice have been discussed previously in this guidance.
Selecting disclosure control methods
Tables must have at least 2 units contributing to any non-zero cell. In some cases, a threshold of 3 can be considered if spontaneous identification of an individual in a cell with 2 people is likely to be significant. A cell count of 2 might leave a single person in the cell who could be identified by differencing.
For most surveys, outputs should be for large geographical areas. For example, regions, or Local Authority Districts in cases of larger samples.
Percentages, rates or other derived values must be based on safe cells.
Units may be people, families, households, or any other unit whose confidentiality should be protected.
Table design is the standard method to remove all unsafe cells. Variable categories should be combined or variables removed until only safe cells remain.
Disclosure by differencing may still occur in tables. Tables published or presented publicly as a group by a single research project or government body must be checked for disclosure by differencing. It is generally not feasible to check across all released tables and the disclosure risks are low, particularly when most access is for research purposes.
Applying your chosen method
Unusual circumstances
Unusual circumstances relating to the data may mean other cells are unsafe. Examples of unusual circumstances include:
- small sub-populations for sometimes readily identifiable variables such as ethnic group, occupation, religion, country of birth, especially if the sample design includes clusters (geographic or other variables)
- other identifiers that could be used in combination with standard area classifications to identify small geographies, for example urban/rural indicators, or deciles of deprivation
- variables that may be considered highly sensitive or of high value to an intruder
The simplest methods of protection involve raising the minimum cell size by either:
- collapsing columns or rows into a smaller number of categories
- increasing the level of geography
As the number of respondents in a cell increases, it rapidly becomes much less likely that a person may be identified.
If the sample design includes high sample fractions for some sub-groups (such as ethnic groups or areas), then disclosure control should be applied as for a census or other whole population data source.
Geography
A minimum population size of 50,000 should be used as a general indication of equivalence to Local Authority District geography. Note that while the City of London and Isles of Scilly are defined as Local Authorities, they must be combined with other geographies to meet the minimum size.
Percentages
Percentages may be released, provided it is not possible to deduce where only 1 unit has contributed to the cell. For example, small percentages may be rounded to zero. Percentages must be rounded sufficiently depending on the sample size on which they are based. It is essential that the underlying cell counts are not released.
Higher level units
The statistical units on which a table is based may belong to another higher-level unit, for example an establishment like a school, care home, or prison. If this higher-level unit is unique in the population for a combination of characteristics, it may be identified by an intruder. For example, if there is only one private school in an area it would be easily identified in a dataset.
It may also be possible to identify the establishment in a table where people in a cell all belong to the same establishment. This means protection needs to be applied to the higher-level unit, as well as the individual unit.
Cluster sampling
Care should be taken with cluster sampling, as the clusters may make identification easier. For example, a cluster sample design based on birth dates will be close to a simple random sample except for biological twins and higher multiple births. Then some cell counts of 2 or more may be a disclosure risk if they consist only of multiple births. The LS provides an example of where this might occur.
The LS sample design makes it critical that no sample members are identified. Identification of a very few LS sample members would lead to the discovery of the sample selection birth dates and much easier identification of all sample members
If clusters are institutions (schools, for example) and the output unit is people (or pupils), there is a higher risk of disclosure. Identification of the cluster unit may be disclosive by itself, or it may help intruders identify people.
If all units in the cluster are sampled (for example, everyone in a household), then identification of the cluster would identify the units within the cluster.
Linked data
Linked data pose distinctive issues. The LS provides an example of where a subsample from one data source (in this case the census) is linked to data from other sources (including other censuses, and birth and death registers). The linkage is called ‘unit record linkage’, which is where records for the same people are matched across all the datasets. In longitudinally linked data, people are matched over time. Disclosure risks are increased for linked datasets because:
- the linked data are often a very rich source of detailed information about people
- transitions over time (such as changes in marital status, location, or employment) may be available from longitudinally linked data – these can be very identifying as they highlight the effect of events occurring to people in limited timeframes
- where publicly available data (such as births) are linked with confidential information (from the census, for example) then identification could be made through the publicly available data
The LS must provide disclosure control for birth data, for example, because there is no confidentiality protection required for the published birth data. The dataset contains all people born on four specific days of the year, the dates being extremely confidential. If the exact date of birth was discovered or made public, it would make identification of a person relatively straightforward. Once a person has been identified in a table, many attributes about that person can be determined.
Implementing your selected method, or methods
Impact on quality
The Code of Practice states on page 6 that “if organisations only focus on the production of the numbers, they risk not fulfilling the practical utility of the statistics and may reduce confidence in the organisation itself and their outputs” (following from the UN Fundamental Principles of Official Statistics). One of the 3 core principles of the code is ‘Quality’, which is defined on page 7 as “…using suitable data and appropriate methods to produce reliable statistics that meet user needs”.
You should consider the needs of the data user when you are designing tables to remove unsafe cells. This is important to ensure the usefulness of published data is not impacted too severely by the confidentiality protection applied.
There is a relationship between quality of an output and the application of disclosure control. Cells with low counts are sometimes not released due to poor quality as they have high sample error. In this case disclosure control is not needed, which means there is little impact on the detail and quality of the published data.
Tools
There are no specialist disclosure software tools needed to work with tables created from subsamples.
Standard Wording
A statement is not needed where disclosure control has had no impact on what is published. However, statements will be needed where disclosure control has affected published data.
If you need to inform data users about the confidentiality protection method applied to the data, you should say:
“Tables have been designed to ensure that the confidentiality of [source data] respondents has been protected.” You should follow this statement with any necessary specific information on the variable categories combined or variables removed.
If you need to inform data users of the impact of confidentiality protection on the quality of data, you should state any information that has been lost due to the need to re-design tables.
No specific wording may be necessary for footnotes to tables. But if variable categories or some cells within the body of the table have been combined to increase cell size, you could say: “variable categories have been combined to protect confidentiality” or “cells have been combined to protect confidentiality”.
The SDC Expert Group can give further details, if needed. You can contact the team by emailing SDC.Queries@ons.gov.uk.
Case studies for tables created from subsamples
A typical table created from a subsample of census data for a specified Region could be a 3-way table of Age by Sex by Ethnic Group.
Table B1.1 shows a subset of the frequency table.
Table B1.1: Age * Sex * Ethnic group for a Region
| Ethnic group | Age 55 | Age 56 | Age 57 | Age 58 |
|---|---|---|---|---|
| White | 55 | 48 | 35 | 34 |
| Mixed | 27 | 21 | 14 | 17 |
| Asian or Asian British | 23 | 13 | 6 | 7 |
| Black or Black British | 11 | 8 | 9 | 3 |
| Chinese or Other | 5 | 3 | 1 | 3 |
In this sample there is a just one male aged 57 with a “Chinese or Other” Ethnic group. This can be defined as an unsafe cell. Disclosure could occur through:
- self-identification if this person sees himself in the table
- group disclosure as this person knows no additional “Chinese or Other” male is aged 57
This does require the person to know they are in the subsample. This could be by knowing that the population count for that cell is also 1, which is plausible with the census as a varied set of standard outputs is published. In those cases, one method of protecting this person is to ensure that if this table is released, ages are grouped into age ranges as consistent with standard outputs as possible. For example, if 5 year age bands are applied here counts for each ethnic group for each sex will be shown as:
- 15 and under
- 16 to 19
- 20 to 24
- 25 to 29
- 30 to 34
- 35 to 39
- 40 to 44
- 45 to 49
- 50 to 54
- 55 to 59
- 60 to 64
- 65 and over
A table of Age * Sex * Industry for a specified region is another example of a 3-way table from a census subsample.
Table B2.1: Age * Sex * Industry for a Region
| Industry | Age 65 | Age 66 | Age 67 | Age 68 |
|---|---|---|---|---|
| Agriculture, Hunting, Forestry | 4 | 1 | 2 | 0 |
| Fishing | 5 | 1 | 1 | 0 |
| Mining, Quarrying | 6 | 2 | 4 | 0 |
| Manufacturing | 4 | 3 | 3 | 0 |
| Electricity, Gas, Water Supply | 7 | 4 | 2 | 0 |
| Construction | 9 | 6 | 3 | 0 |
| Wholesale and retail trade; repair of motor vehicles | 8 | 3 | 4 | 0 |
| Hotels and Restaurants | 3 | 7 | 3 | 0 |
| Transport storage and communication | 4 | 4 | 4 | 0 |
| Real Estate: Renting and Business activities | 2 | 5 | 6 | 0 |
| Public administration and defence: social security | 8 | 3 | 7 | 0 |
| Education | 6 | 4 | 2 | 1 |
| Health and Social work | 2 | 3 | 1 | 0 |
| Other Community: Social and personal service activities | 3 | 5 | 7 | 0 |
| Other: Private Household with employed persons | 1 | 6 | 5 | 0 |
| Other: Extra territorial organisations | 2 | 3 | 2 | 0 |
| Total | 84 | 62 | 59 | 1 |
In this table there are instances of cells containing single counts which can be protected by combining ages (as in Case Study B1).
However, for age 68 there is only a single Male in the column. We may know from published population tables that this person was in the sample, along with their age, which would enable an intruder to know in which industry they work. Once again confidentiality could be maintained by combining ages, although an alternative would be to not publish the “Industry” variable at all. A disadvantage of this is that a large amount of useful data would be lost from the other parts of the table, so an awareness of user needs is vital in assessing the ways in which the table could be protected.
It is important to consider the likelihood of the scenario where the intruder knows everything except the industry. In this case, the intruder would know that someone is male, age 68, is in employment, and is in the sample. The table certainly looks disclosive and the decision may depend on whether the geography is sufficiently low for an intruder to have high confidence in a claim. Another point here relates to user needs: is it really necessary for there to be single year of age (at 68) where the analytical use is extremely limited?
Tables from business surveys
Determining users’ requirements
As with social survey outputs, tables produced from business surveys are widely used for policy purposes. There is less demand from the public for these outputs.
A wide range of standard outputs are produced, along with tables created following ad hoc requests. The main differences between outputs from business surveys and social surveys is that business tables have a magnitude element, as well as a frequency element. A cell in a table may display a total or average value such as turnover from several businesses. This leads to a further element of disclosure risk.
Business survey data are used by the ONS in the production of National Accounts and Balance of Payments. The data may also be provided to Eurostat for combined EU tables, but this is not mandated now the UK has left the EU. Other published tables have a wide range of uses such as for:
- government policy formulation
- allocation of funding
- local body planning
- industry groups and academic researchers
Major data users include the Bank of England, Treasury, and government departments.
Considering the characteristics of the data and proposed tables
Table properties
At the ONS, most tabular outputs from business surveys consist of magnitude tables of:
- financial variables (such as turnover, capital expenditure, or sales)
- employment
However, some financial variables are a net value of two components and may have negative values. For example, capital expenditure is calculated by subtracting disposals from acquisitions.
Outputs can also be tables of counts (or the number of businesses in a category) which are produced from the whole population data on the Business Register. Categories in these commonly include geography, industry, sector, employment size, and product code.
The Standard Industrial Classification (SIC) variable may be at a 2, 3 or 4 digit level while the level of geography varies with the size of the survey, some producing only UK level data, through to outputs from the Business Register at small area level.
There is a trend for outputs to be desired at lower geographies than previously. Regional GDP is now released, and other outputs are requested at varying levels of geography.
Several surveys are used to create Indices such as the Average Earnings Index and publication may be monthly, quarterly, or annual.
Sample design
The Interdepartmental Business Register (IDBR) has details of all businesses registered for PAYE or VAT in the UK. Many business surveys use the IDBR as the sampling frame and have a similar sample design. They are generally based on a stratified sample that includes a full-coverage stratum for the larger businesses. Other strata have differing sample fractions. The businesses in the full-coverage strata are often well known and easily identifiable.
Some business surveys have different sampling frames. For example, the ASHE (Annual Survey of Hours and Earnings) sample is 1% of the working population with the sample coming from Inland Revenue PAYE records. There are also a few very small surveys targeted to specific industry groups such as financial services.
Data quality
Because business surveys carried out for the ONS are compulsory under the Statistics of Trade Act, response rates are generally high, especially for large businesses. The process to follow to convert respondent data to published estimates includes both editing and validation along with imputation.
Likely disclosure risks
Common variables used to define tables, such as geography and industry, may allow the identification of prominent businesses, at least in the case of full-coverage strata. Identification could then lead to the values supplied by respondents being revealed, known as attribute disclosure. For the magnitude tables typically released by business surveys, attribute disclosure means revealing either the exact values or a close approximation.
The Statistics of Trade Act 1947 Section 9 (5) (a) states that “no such report, summary or communication shall disclose the number of returns received with respect to the production of any article if that number is less than five”. The Statistics of Trade and Employment (Northern Ireland) Order 1988 contains the same text.
We may also need to protect data that is commercially sensitive, even if there is no direct risk of identification or attribute disclosure.
Intruder scenarios
There are two types of intruder:
- businesses who also contribute to the cell value
- people not contributing to the cell
One likely motivation for one business attempting to discover another respondent’s value is to gain a commercial advantage. In this case it can be assumed that the intruder is generally well-informed on the situation in that sector of the economy and is able to identify the largest contributors to a cell. The intruder scenarios are as follows:
Scenario 1: A business contributing to a cell identifies another business contributing to the cell and deduces the exact value or a close approximation of the other’s response (this is an internal threat).
Scenario 2: Any person or business, not a member of the cell, attempts to identify a cell respondent and deduce the exact value or a close approximation of the response (this is an external threat).
Elements of outputs that pose a disclosure risk
We need to protect cells where one of the following applies:
- there are a small number of contributors that would allow exact values to be revealed
- there are dominating contributors whose values could be revealed to a close approximation
When doing this, we first assume full coverage.
The threshold rule states that for a cell to be safe there must be a minimum of “n” contributing units. The Statistics of Trade Act (1947) mentions a minimum threshold of 5 “returns” received.
This is a necessary condition, but not a sufficient one. We also wish to prevent a unit contributing to the cell from finding out the value of another unit in the cell to within a certain approximation. The approximation is defined as p% of the true value. This leads to the definition of unsafe cells using the p% rule for scenario 2. The p% rule also provides protection against scenario 1 since in this situation less information is available to the intruder.
The p% rule states that for a cell to be safe, the total of the cell (“T”) minus the largest “m” contributor (or contributors) must be greater than or equal to p% of the value of the largest. If we set m=2 and p=10%, this can be written as the following to represent a safe cell:
$$\frac{(T – x_1 – x_2)}{x_1} \geq 0.1$$
x1 is the value of the largest contributor and x2 is the value of the second largest contributor.
Many outputs are calculated using weights to ensure the sample is a good representation of the population. The published cell total is calculated using these weights. This provides additional protection as these weights will usually not be known. Assuming the weights are not known, the rules are typically applied using these weighted totals. The values of the two largest contributors remain unweighted, as these are the values we are aiming to protect, not the weighted ones.
The observation units for business surveys are known as Reporting Units. It is these entities which complete the survey. In addition to these, there are statistical units defined as Enterprises, Enterprise Groups and Local Units:
- an Enterprise Group is a group of legal units under common ownership with financial links, the top level of the structure
- an Enterprise (sometimes referred to as a business, company, or main operating entity) is the smallest combination of legal units that is an organisational unit producing goods or services, which benefits from a certain degree of independence in decision-making
- each Enterprise can comprise several Reporting Units (a grouping of local units) – this is the business unit to which the survey is sent
- a Reporting Unit is the unit or business segment from which the data are surveyed or reports the data, this can vary from a single location, department, or legal entity to a group of components
- a Local Unit is an individual site or physical location (for example a factory or shop) within an Enterprise at which the enterprise carries out business activity – each local unit has an address and an industrial classification (SIC code)
To consider business data in more general terms, units held on the Inter Departmental Business Register can be grouped into the following three types, Observation Unit, Statistical Unit and Administrative Unit. This is shown in this IDBR structure diagram.
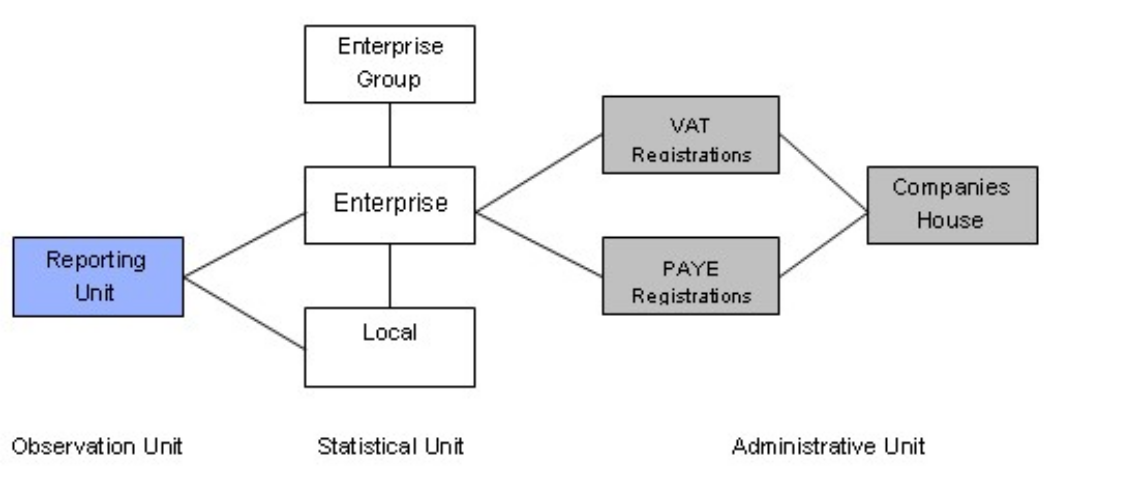
In summary, the diagram shows the Observation Unit consisting of Reporting Units. These hold the mailing address to which the survey questionnaires are sent. The questionnaire can cover the enterprise as a whole, or parts of the enterprise identified by lists of local units.
The Observation Unit can be broken down into a Statistical Unit, consisting of:
- a Local Unit, the location at which the business takes place – this is an individual site such as a factory or shop
- an Enterprise, which consists of one or more reporting units
- an Enterprise Group, the highest level consisting of linked enterprises and local units – an Enterprise Group is a group of legal units under common ownership
An Enterprise is the smallest combination of legal units (generally based on VAT records, PAYE records, or both), which has a certain degree of autonomy within an Enterprise Group.
The administrative unit refers to terms used in tax law. Enterprises which have a separate accounting structure can register for VAT (Value Added Tax) and PAYE (Pay as You Earn). Both PAYE and VAT registrations are submitted to Companies House.
Disclosure control for outputs produced by ONS is considered in terms of Reporting Units and Enterprise Groups.
The threshold rule is conventionally applied at Enterprise Group level to prevent disclosure of the exact value supplied by the whole Enterprise Group. This also protects the responses of all lower units belonging to the same Enterprise Group.
The p% rule is applied at Reporting Unit level and prevents one Reporting Unit finding out the value of another Reporting Unit in the cell to within p%.
When publishing data, it is important to be aware of other information likely to be available to third parties. Information about businesses is often widely available through advertising, public websites, social media, and many other means. The Companies House data is a list of businesses available to the public which is used as a secondary source for compiling the IDBR. The main sources for compiling the IDBR (the VAT trader system and PAYE employer system) are held securely by HM Revenue and Customs.
Extensive public knowledge of the existence, location and general characteristics of businesses means that apparent identification is often likely to be correct.
Other tables released from the same data source provide another main source of information and can lead to disclosure in several ways.
If tables are released as averages, rates or percentages, the numbers by themselves may not be disclosive. However, when combined with other tables it may be possible to recover the totals on which they are based, which may be disclosive. An average, rate or percentage calculated from an unsafe cell is considered unsafe if the original total can be recovered.
Considering outputs more generally, descriptive statistics include:
- individual values such as the maximum and minimum of a variable – these can be disclosive if they relate to an individual, household or other statistical unit
- summaries of location (mean and median) – a median value will either be an actual value or calculated from a pair of observations
- range (variance)
- distribution (quantiles) – statistics such as quantiles will be disclosive if they are based on a small number of observations
Disclosure by differencing can occur if two similar tables are released and disclosive information can be revealed by subtracting the values of one from the other. If a table is published displaying turnover for a defined high level Industry level and a second table is requested (possibly through a Freedom of Information request) for all but one of the businesses within the specified industry, the turnover of the unaccounted business can be found. If this cell fails one of the standard safety rules, then disclosive data will have been inadvertently released.
Linked tables are tables derived from the same microdata where some of the cells are common to each table. For example, a table of geography and industry will have the same area totals as a table of geography by size. Care must be taken to ensure that the protection provided in one table is not compromised by common cells released in a linked table.
The Statistics of Trade Act states the number of returns received should not be disclosed if that number is less than 5. This means that cells with fewer than 5 respondents are unsafe in many circumstances for tables of counts of businesses. For magnitude tables, counts of the number of contributing respondents are also likely to be unsafe if fewer than 5. In both cases, any counts of the number of businesses may be unsafe because knowledge of the exact number of respondents can make it easier to determine respondent values in magnitude tables.
Elements of outputs that do not pose a disclosure risk
The disclosure control rules recognise links within Enterprise Groups (since these are defined on the IDBR), but no other more informal relationships, such as franchises. The risk of businesses other than those within Enterprise Groups combining their information is considered to be low and is an acceptable disclosure risk. No further protection is necessary.
Zero cells do not normally create a disclosure risk in sample data as they may do for population data. Zeros in population data allow users to say that all others in a row or column do not fall into the category of the zero cell. A zero value from a small sample does not allow anyone to infer that no-one in the population has those characteristics. If the sample is large or there is complete coverage of the strata then some zeros could be disclosive. However, this risk is considered low.
Legal, ethical and trust considerations
Relevant Acts along with the Code of Practice have been discussed previously in this guidance.
Selecting disclosure control methods
Magnitude tables
The threshold and p% rules define unsafe cells in magnitude tables. A cell is non-disclosive if it meets the:
- threshold rule, with at least “n” enterprise groups in a cell
- p% rule, where the total of the cell minus the largest two reporting units must be greater than or equal to p% of the value of the largest reporting unit
The values of the p% and minimum threshold parameter “n” should remain confidential, since knowledge of these values reduces the protection.
An alternative to the p% rule is the “(n,k) rule”, which is also known as the dominance rule. This states that a cell is disclosive if the top “n” contributors account for more than k% of the cell total. Example parameter values are (1,60), (1,75) and (2,90) although as stated above, the exact parameters used for any specific release should not be made public.
These rules are similar, but to summarise: the p% rule protects against an intruder who is a contributor to a cell and the (n,k) rule protects against an intruder who is external to the cell. In both the p% and (n,k) rules, the values of the parameters should be selected in accordance with the risk appetite of the Information Asset Owner. If you need any advice on this, you can contact the SDC Expert Group by emailing SDC.Queries@ons.gov.uk.
Table design should be used first to reduce the number of unsafe cells in a table where this is consistent with the main uses of the data.
Cell suppression is the standard method used to protect tables with unsafe cells. The unsafe cells are suppressed, known as ‘primary suppressions’. Other cells must be suppressed to prevent the values of the unsafe cells being calculated by subtraction from the marginal totals of the table. These suppressions are known as ‘secondary suppressions’. Cell suppression could be implemented using the Tau Argus software, or other similar software.
It is important to note that cell suppression does not generally provide protection from disclosure by differencing. Tables should be published using fixed variable breakdowns to avoid disclosure by differencing. For example, the same standard geographies and SIC codes should always be used, and care should be taken if tables are released with overlapping categories. There is more on this subject in the “Ad hoc requests and other linked tables” section of this guidance. For further advice on this topic please contact the Statistical Disclosure Control Expert Group by emailing SDC.Queries@ons.gov.uk.
This is general advice for protecting magnitude tables produced from business surveys. The SDC Expert Group are reviewing a more detailed method which takes into account other factors relating to the collection and publication of business data. Examples include
- rounding the published cell total
- estimated values contributing to the cell total
There is an element of disclosure risk mitigation inherent in these and other methods. If you would like more information on this, please contact the SDC Expert Group by emailing SDC.Queries@ons.gov.uk.
Tables of counts
Controlled rounding to a defined base preserves the additivity within a table and is the preferred method to protect tables of count data. Base 5 is a common option. Controlled rounding to base 5 introduces ambiguity to prevent intruders from working out exact counts. In theory a rounded value of “0” could represent any value, though in practice it will be in the range [0,4] in all but the most unusual tables. Likewise, a rounded value of “5” will almost certainly be any value in the range [1,9]. In general, a cell value may be rounded to a higher or lower multiple of the rounding base to maintain additivity. However, this will occur very infrequently.
Controlled rounding to base 5 provides good protection against disclosure by differencing and for disclosure by comparison of common cells in linked tables. The uncertainty for a true value of small count may be reduced in these cases to [1,4] but this may still provide enough uncertainty for confidentiality protection.
Controlled rounding may be implemented using Tau Argus or other similar programs that include an inbuilt linear solver or are enabled to call an external solver.
Guidance on applying the method
The level of the p% value
The level of the p% value used protects against an intruder who attempts a straightforward calculation of a competitor’s response. The value of “p” chosen will depend on the level of protection required, which will be informed by the sensitivity of the data and the likely impact of a disclosure.
An intruder who is able and willing to use more sophisticated techniques could estimate a respondent’s value to closer than the nominal p% protection and a lower value of “p” will enable the intruder to make a more accurate estimate. An intruder may be motivated to do this because the value of a competitor’s response would provide them with a large commercial advantage. If a survey considers that the risk of sophisticated methods being used to obtain individual respondent data outweighs the value of the data to legitimate users, then a higher value of “p” may be used. Typically, “p” values are selected in the range 5% to 25%.
Ad hoc requests and other linked tables
Cell suppression is applied to standard published tables. If there are common cells between standard published tables, then secondary suppressions should be consistent. A cell used as a secondary suppression in one published table should also be suppressed if it appears in another published table.
When additional ad hoc tables are released to customers, it is difficult to ensure that cell suppressions are consistent with all previously released tables. Where common cells exist in linked tables, the same primary suppressions will result, but secondary suppression patterns may be different. New ad hoc releases should be checked against the standard published tables to ensure secondary suppressions are not revealed. Consistency with other ad hoc releases should be considered unless the resources required are unreasonable.
Units for the p% rule
Application of the threshold and p% rules at higher levels also guarantees protection at lower levels. The threshold rule applied at Enterprise Group level, for example, also protects the values of all Reporting Units and local units. However, the reverse is not true. A cell that is disclosive at Reporting Unit level will also be disclosive if the p% rule is applied at Enterprise Group level, but it is not true that a safe cell at Reporting Unit level will always be safe at Enterprise Group level.
There remains the possibility that Reporting Units from the same Enterprise Group could combine their results and obtain accurate estimates of another Enterprise Group from the same cell. If this is a serious disclosure risk, then the p% rule could be applied at Enterprise Group level.
Derived values
Derived data (such as averages, percentages and rates) should be based on protected data. This means that an average must be suppressed if the total from which it is derived has been suppressed.
For count tables, percentages or rates must be derived from rounded values. No further protection is needed.
Negative numbers
Negative numbers can occur in some magnitude tables. For example, negative numbers can be reported in tables of Foreign and Direct Investment if the value of imports from a country exceed the value of exports to that country. Where negative numbers appear in magnitude tables, methods for identifying disclosure risks and protecting the data must be modified. Please contact the SDC Expert Group for more information on this by emailing SDC.Queries@ons.gov.uk.
Implementing your selected method, or methods
Impact on quality
The Code of Practice states on page 6 that “if organisations only focus on the production of the numbers, they risk not fulfilling the practical utility of the statistics and may reduce confidence in the organisation itself and their outputs” (following from the UN Fundamental Principles of Official Statistics). One of the 3 core principles of the code is ‘Quality’, which is defined on page 7 as “…using suitable data and appropriate methods to produce reliable statistics that meet user needs”.
Protection of confidentiality through cell suppression can lead to a high loss of information. Up to three secondary suppressions are needed to protect one unsafe primary suppression. This can lead to many suppressed cells. Large businesses that dominate an industry are often a disclosure risk and are suppressed, but would also contribute to high quality estimates when they are part of full coverage strata.
Loss of information can be minimised by
- designing tables to reduce the number of unsafe cells by combining categories
- optimising the cell suppression to minimise the total value of cells suppressed
- gaining written express consent from businesses to allow publication of critical cells
Tools
Tau Argus can apply both primary and (near optimal) secondary suppression along with controlled rounding.
Standard wording
If you need to tell users about cell suppression, you could say something like:
“Cells have been suppressed to protect confidentiality. The confidentiality of respondent information is protected by suppressing cells that are unsafe. These are known as “primary suppressions”. Other cells must also be suppressed to prevent the values of the unsafe cells being calculated by subtraction from the marginal totals of the table. These are known as “secondary suppressions”. There is no distinction in the tables between those cells that have been primary or secondary suppressed.”
If you need to tell users about controlled rounding, you could say something like:
“Cells have been rounded to protect confidentiality. Controlled rounding to base 5 has been used. Controlled rounding means that cells are rounded up or down to the adjacent multiples of 5 in a way that retains the additivity of tables. For example, an original value of 23 is likely to be rounded to either 20 or 25. As rounded values in a row or column will always add up to the rounded row or column total, occasionally values will be rounded to another multiple of the rounding base. For example, 23 could be rounded to 15 or 30, although this will occur infrequently.
Original cell values of zero or multiples of the base are unchanged. Values may be rounded down to zero. This means zeros present in the published tables are not necessarily true zeros.”
Informing data users about the impact of disclosure control on the quality of data
The impact of disclosure control on data quality will vary depending on the table. By designing tables to avoid unsafe cells, the detail available to data users may be reduced. For example, detail can be reduced when variable categories are combined or when the level of geography or industry is restricted. Protection of unsafe cells through cell suppression results in the complete loss of the information in the suppressed cells. Other published cells remain unchanged. If Tau Argus is used for secondary suppression, cells are chosen for secondary suppression in a way that minimise a cost function chosen by the user. This could be the total value lost, for example.
Controlled rounding affects the original cell values. A cell value will increase or decrease by between 0 and 4, compared to the original value. The table remains additive, and the error on the total is controlled so that totals also do not change by more than 4 from the original values. For large cell values the relative difference between original and rounded values is very small. Rounding has most impact on data quality for small original cell values where the relative change may be large. Controlled rounding is optimised to achieve the smallest change from all original values while still retaining additivity. Occasionally, on very large or difficult tables, some cells may change value by more than 4 to achieve this additivity.
Standard wording for footnotes
There are some standard statements to include with footnotes.
When you need to inform users about cell suppression, you should say:
“[symbol] Cells have been suppressed to protect confidentiality.”
“c” is the standard symbol used.
When you need to inform users about controlled rounding, you should say:
“Cells have been rounded to base 5 to protect confidentiality. The rounding is controlled so that the table remains additive.”
Scenario 1: Region Y, 5 digit SIC classification
A cell reveals there is 1 person with average weekly earnings of £450. Clearly, if this cell is published, information about this person could be in the public domain. The recommendation would be to either:
- publish the data at a higher SIC level so there are more people in the category
- suppress this cell along with other cells to avoid disclosure by differencing
Scenario 2: Region X, 5 digit SIC classification
A cell reveals there are 2 people with average weekly earnings of £400. If this cell is published, each person could calculate the earnings of the other. The recommendation would be to either:
- publish the data at a higher SIC level
- suppress this cell along with other cells to avoid disclosure by differencing
A cell reveals there are 5 people with average weekly earnings of £244. The 5 people actually earn £1000, £70, £60, £50 and £40 respectively, which gives an average of £244. The second contributor can work out the total value and an estimate of the earnings of the largest contributor to the cell (total = 244* 5 = 1220; estimate = 1220 – 70 = 1150). By applying the p% rule with p = 20%, this cell can be shown to be disclosive. This cell can be suppressed, or the table can be redesigned.
The previous case studies recommended either redesigning the table or suppressing cells to protect the table. Another possibility (especially for frequency tables) is rounding. This has several variations, but typically each cell value is changed to a multiple of a rounding base. Possible base values are 3, 5, 10 or 100, with the nature of the data determining the level of rounding required.
One example is the following extract from a table showing the distribution of net financial wealth from April 2020 to March 2022 by region in the Wealth and Assets Survey, where weighted values are rounded to the nearest 100.
Table C3.1: Distribution of net financial wealth from April 2020 to March 2022 by region
| Household Net Financial Wealth 50th percentile point - median (£) |
Unweighted frequency | Weighted frequency | |
|---|---|---|---|
| North East | 5,200 | 785 | 1,180,000 |
| North West | 6,000 | 1,633 | 3,211,000 |
| Yorkshire and the Humber | 6,700 | 1,476 | 2,317,000 |
| East Midlands | 7,900 | 1,234 | 1,932,000 |
| West Midlands | 9,700 | 1,326 | 2,403,000 |
| East of England | 14,000 | 1,617 | 2,576,000 |
| London | 10,600 | 1,214 | 3,357,000 |
| South East | 22,000 | 2,210 | 3,767,000 |
| South West | 14,100 | 1,586 | 2,392,000 |
| All England Regions | 10,500 | 13,081 | 23,136,000 |
| Wales | 7,200 | 820 | 1,348,000 |
| Scotland | 12,000 | 1,229 | 2,506,000 |
| Great Britain | 10,400 | 15,130 | 26,991,000 |
View the full “Financial wealth: wealth in Great Britain” table on the ONS website.
Help and support
If you would like to discuss any issues related to applying statistical disclosure control to tabular outputs from survey data, please contact the SDC Expert Group by emailing SDC.Queries@ons.gov.uk.
See a flowchart of the SDC process from receiving data to output.