Local childcare realities: uncovering childcare deserts and oases in England

Working parents need childcare!
Parents are more likely to enter the labour market if they have access to childcare. Competition for places, proximity to providers, quality of care and affordability all play a role in a parent’s decision to use childcare.
Following the expansion of government-funded childcare available to working parents, ensuring there is sufficient and equitable childcare accessibility is critical for policy and decision makers.
With the number of childcare providers falling in the last decade, it is clear that childcare accessibility for parents and carers has also decreased. However, this decline is not spread evenly across the country and has contributed to an uneven playing field when parents look to enter the labour market.
Data linkage of commercial data and our own data enabled the development of innovative methods accounting for travel time and the number of local children. This approach allowed us to look under the surface to uncover childcare deserts (local areas with low childcare accessibility) and childcare oases (local areas with high childcare accessibility).
Extending the method into use as a planning tool can ensure future provision is located where it is required and maximise local area investment. This is of ultimate benefit to working parents and carers.
The hidden and uneven decline in childcare accessibility
In March 2024, the South East and London had the highest childcare accessibility. This reflects the high number of childcare providers in these regions whilst also mirroring geographical patterns observed in income and productivity analysis.
Between March 2020 and March 2024, London was the only region to have an increase in childcare accessibility. All other regions had a decrease of varying proportions.
Digging below regional level and looking at output area accessibility shows that the regional disparity in childcare accessibility is not as clear cut as first thought. Some local areas experience persistently low childcare accessibility while other areas have consistently high accessibility. These are the childcare deserts and childcare oases respectively.
Disadvantaged areas tend to have lower childcare accessibility
The childcare deserts, on average, have lower household incomes and are typically more deprived compared to other areas.
Rural areas have a disproportionately high prevalence of childcare deserts. Providers might be less willing to open in these areas due to low population densities or a lack of connectivity. Regardless, the lower childcare accessibility for parents and carers in these areas is likely a barrier for labour market participation.
On the other hand, childcare oases have higher household incomes and lower levels of deprivation. A higher than average proportion are also in urban areas, particularly suburbs. Residents in these areas are often employed in professional and managerial roles with degree-level education being common.
Whether high childcare accessibility facilitates employment of those in childcare oases, or whether more childcare providers open in areas where professional and managerial employment is common, cannot be answered by this analysis. However, parents in these areas are certainly benefiting from this level of childcare accessibility.
Accessibility inequalities within local authorities
Even within the same local authority, the experience of parents and carers can be different when it comes to accessing childcare.
Pockets of high and low accessibility exist. The factors distinguishing these pockets are nuanced and, in some cases, distinct differences in childcare accessibility can be seen either side of inner city motorways.
Figure 1: An example of the differences in childcare accessibility hidden beneath the local authority surface
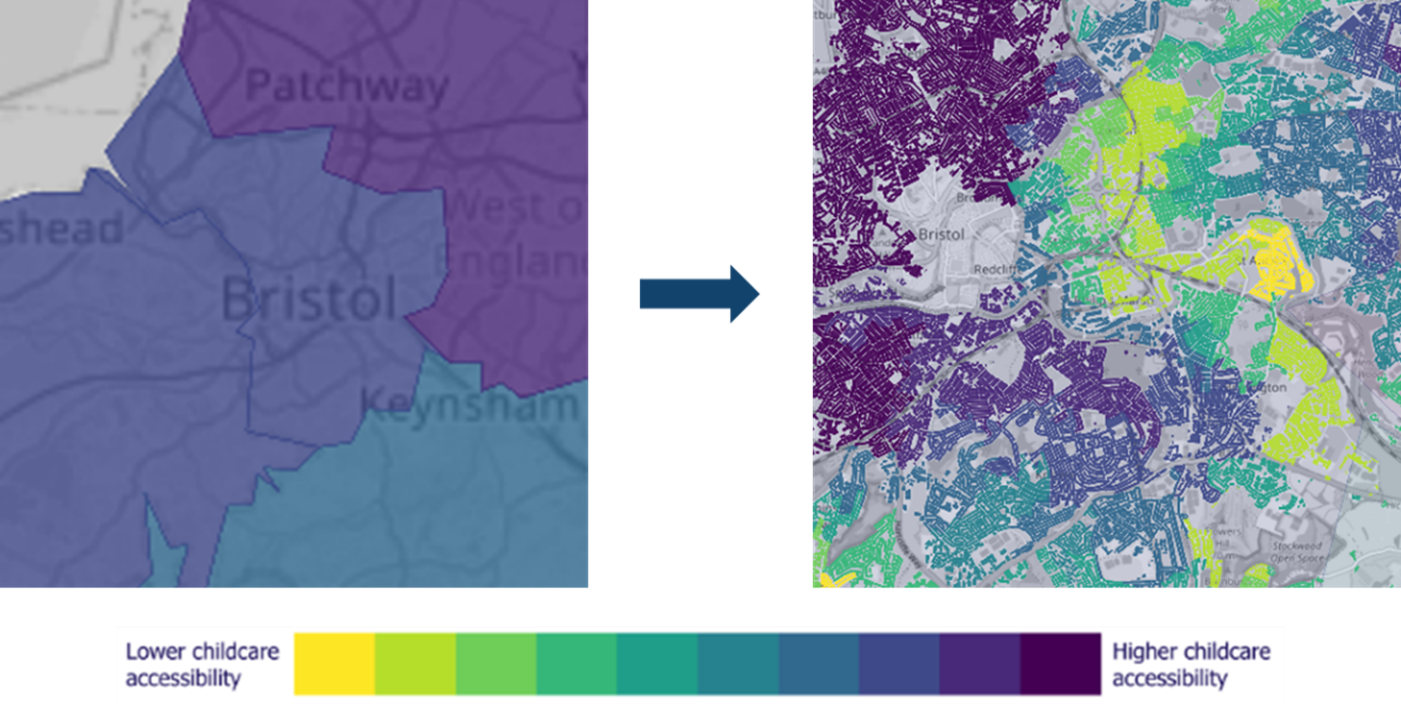
The image above shows an example of the differences in childcare accessibility hidden beneath the local authority surface. On the left-hand local authority map of the Bristol area, the blue, purple and teal colours seen represent medium and high childcare accessibility. However, when we look at the right hand map showing Lower Layer Super Output Areas in Bristol, there are pockets of yellow and green displayed between the purple, blue and teal; indicating lower childcare accessibility in these pockets.
With the largest local authority taking three hours to travel from one end to the other, blanket approaches to quantifying childcare access cannot be taken. The need exists to understand these pockets of high and low accessibility in greater detail and ensure specific areas are prioritised.
Optimising the locations of new childcare providers
Targeted interventions can be used to ensure new childcare providers are opening where they are needed most.
A theoretical piece of analysis showed decreasing the variability of childcare accessibility and removing the current disparity is possible, even when considering both travel times and resident populations.
In a hypothetical scenario, where existing childcare providers could be picked up and redistributed, optimisation modelling reduced the variation in childcare accessibility across a local authority.
As expected, areas which saw increases in childcare places, overall, had lower household incomes, lower levels of qualifications and higher levels of deprivation.
The same approach could be applied when new providers are joining the sector to ensure they are opening in the locations which would have the greatest impact. In doing so, parents would have a higher chance of finding suitable childcare and be more likely to re-enter the labour market.
We know what you are thinking!
Are you wondering what childcare accessibility looks like in your local area? The good news for you is you can explore this using the postcode search in our first and joint publication with the Office for National Statistics. You can view the interactive visualisations attached to our second publication and zoom into the maps to unveil the hidden patterns below the local authority surface.
Adam Sutton